|
...
...
...
|
Article ID: 1316
Last updated: 06 Jan, 2022
How to Check Which Process Consumes Maximum Resources from Plesk Panel.For Plesk Version Onyx and higher.1. Go to Tools & Settings > Process List (under Assistance and Troubleshooting). Note: If Process List is not available, make sure that the Repair Kit Plesk Extension.
3. Turn on Auto-update of resource usage to track processes in real-time.
4. To sort the processes by CPU usage, Memory usage, Disk I/O (read), Disk I/O (write), click on the corresponding column.
For the Plesk version older than Onyx, this can be checked with the Watchdog extension (A module for monitoring Plesk control panel services) as the Proccesslist extension is not available for the lower version of Plesk1. Go to Extensions > Watchdog > the Statistics tab.
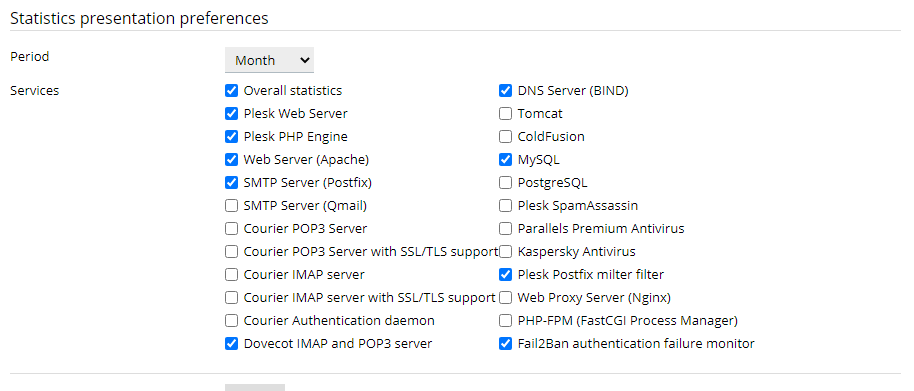
2. In the Statistics presentation preferences group, select the period and system services for which you would like to view statistics. 3. Click Apply.
4. CPU and RAM usage diagrams will be presented on the screen. The CPU Usage diagram will show the total load for all CPUs your server may have.
This article was:
Report an issue
Article ID: 1316
Last updated: 06 Jan, 2022
Revision: 10
Views: 786
Comments: 0
|

.png)
.png)


Powered by KBPublisher (Knowledge base software)