|
|
Article ID: 1061
Last updated: 18 Jul, 2018
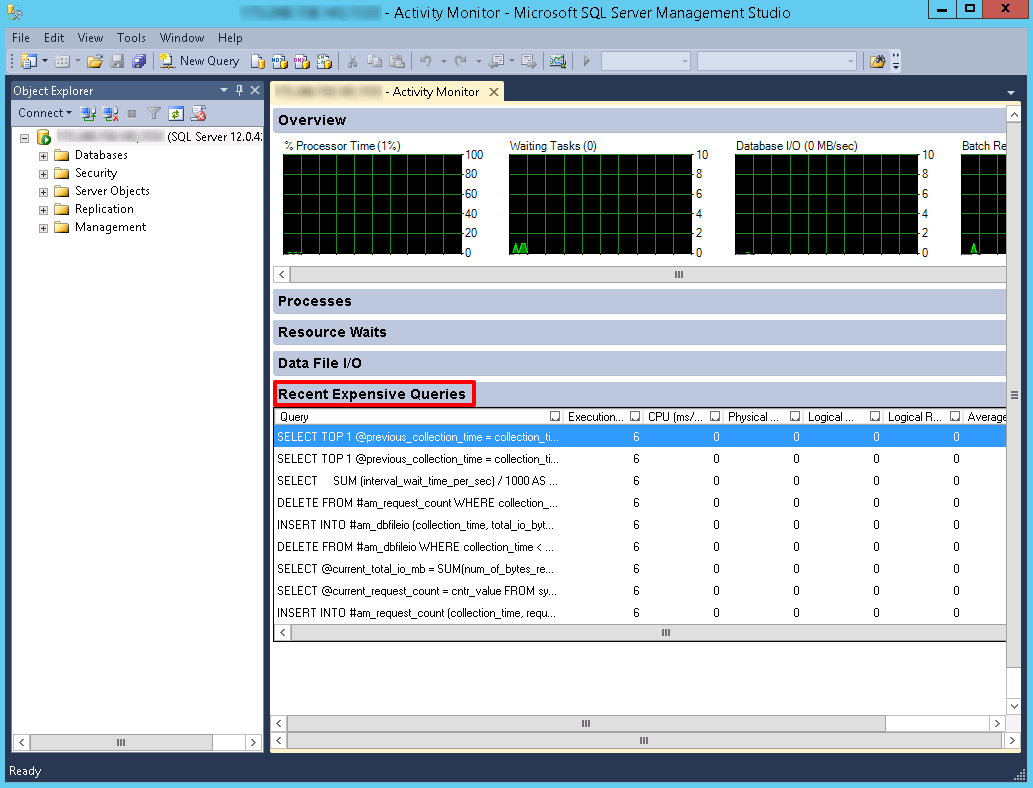
There are certain ways to identify and troubleshoot long running queries.This prevents potential performance issues. SQL Activity Monitor is the easiest and rich UI tool available in SQL Server Management Studio.It provides information about processor time, waiting tasks, database I/O, and batch requests, and recent expensive queries. The following steps describes how to identify the recent expensive queries.
3. The information about the CPU,RAM,disk and execution time of each query can be analyzed on SQL activity monitor.The queries with highest resource usage and maximum time execution queries are displayed in “Recent Expensive Queries”.
4. Mouse hover to the query column to read the complete query.You need to optimize the query as much as possible to reduce the execution time and resource usage.You can directly edit the query in a text editor.Right-click the query and click on “Edit Query Text.”
5. The CPU(ms/sec) column shows how much processor time is used by query since the last compilation.It’s the ratio of processor time used by the query per second.
This article was:
Report an issue
Article ID: 1061
Last updated: 18 Jul, 2018
Revision: 4
Views: 546
Comments: 0
|


Powered by KBPublisher (Knowledge base software)